NTTO: Travel Volume, Spend, and Air Traffic Reports Show Growth
The National Travel and Tourism Office (NTTO) recently released data inbound travel data for arrivals/departures in June, visitor spend in July, and international air travel in August – all of which indicate continued growth for international inbound travel to the U.S.
International Arrivals and Departures for June
In June, international visitor arrivals to the U.S. totaled 5,639,831, an increase of 13.2 percent compared to June 2023 and represented 89 percent of the pre-COVID total visitor volume reported for June 2019.
Overseas visitor volume of 2,901,542 increased 7 percent from June 2023, making June the 39th consecutive month that total international arrivals increased on a year-over-year (YOY) basis. June was the 16th consecutive month that overseas visitors totaled over 2 million.
The largest number of international visitor arrivals was from Canada (1,430,418), Mexico (1,307,871), the United Kingdom (286,654), India (233,149), and Brazil (137,762). Combined, these top 5 source markets accounted for 60.2 percent of total international arrivals.
Outbound departures by U.S. citizens totaled 11,206,043, an increase of 7.9 percent compared to June 2023 and were 107.3 percent of total departures in pre-pandemic June 2019.
June was the 39th consecutive month that total U.S. citizen international visitor departures increased on a YOY basis. The year-to- date (YTD) market share for North America (Mexico & Canada) was 48.6 percent and overseas was 51.4 percent.
Mexico recorded the largest outbound visitor volume of 3,276,884 (29.2 percent of total departures for June and 37.3 percent (YTD)). Canada recorded a YOY increase of 7.7 percent. Combined YTD, Mexico (19,240,054) and the Caribbean (6,137,221) accounted for 49.2 percent of total U.S. citizen departures.
Europe was the second largest market for outbound U.S. visitors with 3,002,181 departures accounting for 26.8 percent of all departures in June. Outbound visitation to Europe in June increased 11.4 percent compared to June 2023.
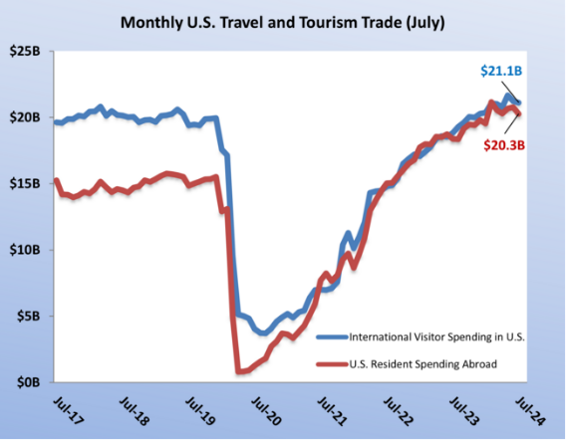
International Visitors Spent $21.1 Billion in July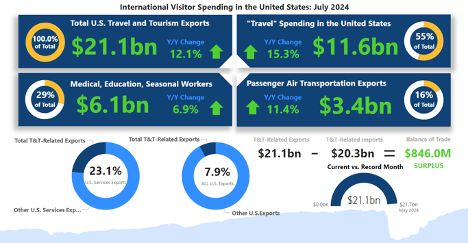
International visitors spent $21.1 billion on travel to, and tourism-related activities within, the United States in July, an increase of more than 12 percent compared to July 2023, according to the National Travel and Tourism Office (NTTO). Conversely, Americans spent nearly $20.3 billion traveling abroad during July, yielding an $846 million balance of trade surplus for travel and tourism-related goods and services.
International visitors have spent more than $147.2 billion on U.S. travel and tourism-related goods and services year to date (January through July 2024), an increase of 16 percent when compared 2023. International visitors have injected, on average, $694 million a day into the U.S. economy year to date.
U.S. travel and tourism exports accounted for 23.1 percent of U.S. services exports during July and 7.9 percent of all U.S. exports, goods and services alike.
Composition of Monthly Spending (Travel Exports)
Travel Spending. Travel receipts accounted for 55 percent of total U.S. travel and tourism exports in July.
Purchases of travel and tourism-related goods and services by international visitors totaled $11.6 billion during July, an increase of 15 percent when compared to the previous year ($10 billion in July 2023). These goods and services include food, lodging, recreation, gifts, entertainment, local transportation, and other items incidental to foreign travel.
Passenger Fare Receipts. Passenger fare receipts accounted for 16 percent of total U.S. travel and tourism exports during July.
Fares received by U.S. carriers from international visitors totaled $3.4 billion in July, up 11 percent when compared to July 2023 ($3 billion in the previous year).
Medical/Education/Short-Term Worker Spending. Medical tourism, education, and short-term worker expenditures accounted for 29 percent of total U.S. travel and tourism exports in July.
Expenditures for educational and health-related tourism, along with all expenditures by border, seasonal, and other short-term workers totaled $6.1 billion in July, an increase of 7 percent when compared to the previous year ($5.7 billion in July 2023).
Air Traffic To and From the U.S. Up in August
Latest report on international air traffic to and from the U.S. also supports inbound growth trend.
U.S.- international air traffic passenger enplanements totaled 25.3million in August, up 7.2 percent compared to August 2023, with enplanements reaching 103.4 percent of pre-pandemic August 2019 volume.
Originating Non-Stop Air Travel in August
Non-U.S. citizen air passenger arrivals from foreign countries totaled 5.8 million in August, up 5.2 percent compared to August 2023. This represents 91.6 percent of pre-pandemic August 2019 volume.
On a related note, overseas visitor arrivals totaled 3.6 million in August, the 34th consecutive month overseas visitor arrivals exceeded 1 million. August overseas visitor arrivals reached 88.5 percent of pre-pandemic August 2019 volume, up from 85.6 percent in July.
U.S. citizen air passenger departures to foreign countries totaled 6.3 million up 9.4 percent compared to August 2023. This exceeded August 2019 volume by 18.7 percent.
World Region Highlights in August 2024
Total air passenger travel (arrivals and departures) between the United States and other countries were led by Canada 3.225 million, Mexico 3.154 million, the United Kingdom 2.173 million, Germany 1.169 million, and France 1.046 million.
International Regional air travel to/from the United States:
- Europe totaled 8.445 million passengers, up 8.8 percent over August 2023 and up 2.2 percent compared to August 2019. U.S citizen departures were up 19.7 percent compared to August 2019, while European citizen arrivals were down -12.6 percent.
- South/Central America/Caribbean totaled 5.852 million, up 5.4 percent over August 2023 and up 13.5 percent compared to August 2019.
- Asia totaled 2.666 million passengers, up 14.9 percent over August 2023, but down (-25.2 percent) compared to August 2019. Asian citizen arrivals to the U.S. were down -34.7 percent compared to August 2019, and U.S. citizen departures were down -3 percent.
- Top U.S. Ports serving international locations were New York (JFK) 3.768 million, Los Angeles (LAX) 2.250 million, Miami (MIA) 2.168 million, Newark (EWR) 1.562 million, San Francisco (SFO) 1.526 million.
- Top Foreign Ports serving U.S. locations were London Heathrow (LHR) 1.758 million, Toronto (YYZ) 1.171 million, Paris (CDG) 914,000, Cancun (CUN) 904,000, and Frankfurt (FRA) 776,000